Pittsford Village 2019 Survey, Seven Years Later — What 287 Residents Said, and What Still Rings True
The Short Version
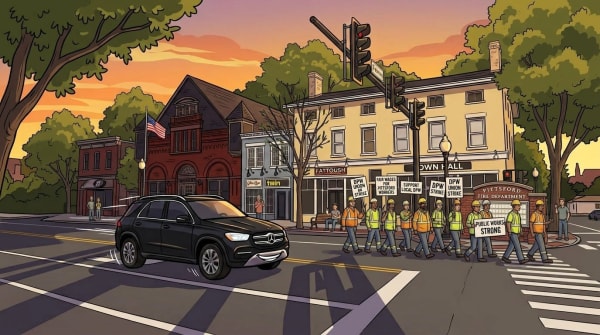
- Pittsford's DPW rated 83% excellent or good in the Village's last formal survey — so far above every other department that researchers abandoned their normal scoring scale and wrote '+++' in the margin.
- Speed of traffic was the single worst-rated concern in the entire survey, with 54% of residents rating it poor — a majority, not a plurality, and a frustration that stretches back nearly four decades by some residents' accounts.
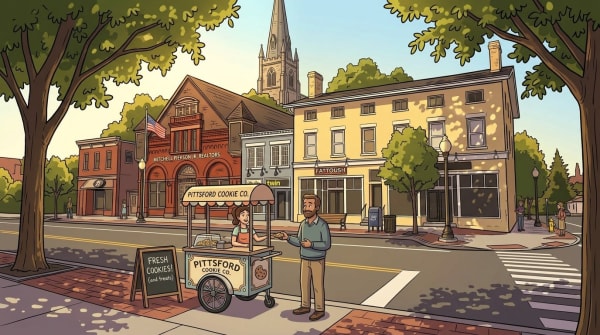
- Retail health and commercial variety both rated 71-73% fair or poor, with residents mourning the loss of a grocery store, pharmacy, and hardware store more than anything else — the walkability they chose Pittsford for has been hollowed out.
- On the Northwest Quadrant, 76% of residents wanted green space and trails — and they got it; the Erie Canal Park and Preserve opened by 2020, one of the cleaner examples of the Village listening to its community.
- 75 Monroe went through 15 years, 179 public meetings, multiple lawsuits, and a near-35% reduction in size before final approval in 2022; Westport Crossing is now leasing for Fall 2026 move-in.
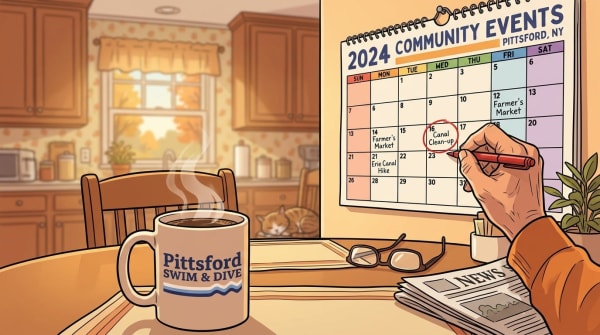
- The Village has not conducted a formal resident survey since 2019 — seven years without systematically asking what residents think, in a community where 287 people responded at nearly triple the industry norm when someone finally did ask.
A Snapshot in Time: The Last Time Pittsford Asked

A Snapshot in Time: The Last Time Pittsford Asked
In early 2019, the Village of Pittsford did something quietly remarkable. It commissioned Harvey Research, Inc. to mail a survey to every adult household — all 1,010 of them — and ask residents what they actually thought. About their streets, their government, their neighbors, their future. About what was working and what wasn't.
287 people wrote back. That's a 28.4% response rate — more than triple what professional researchers typically expect from a mailed survey. According to Harvey Research, their typical response rate for similar four-page surveys is 8 to 10 percent. Pittsford's residents nearly tripled that. People wanted to be heard.
What they said is worth reading carefully, even now, seven years later. Not because everything in it still applies — some of it doesn't, and we'll say so clearly as we go. But because the data captures something durable about what makes this Village work, and what makes it hard.
And one finding in particular stands out above everything else.
Of all the departments and boards the Village operates — the Mayor's Office, the Board of Trustees, the Planning and Zoning Board, the Historic Preservation Board — one entity rated so far above the rest that the researchers abandoned their normal scoring scale and simply wrote "+++" in the margin.

The Department of Public Works.
The people who plow your sidewalk at 5am. Who collect your leaves in October. Who fix the catch basin on your street without anyone having to fight about it. Residents rated them 83% excellent or good. The next closest was Village Hall staff at 68%. The governance boards clustered in the mid-30s.
That gap is the story this data keeps telling. Pittsford residents chose to live in a place built by collective investment — the canal, the sidewalks, the library, the historic streetscape. They know what good government feels like when it shows up, reliably, season after season. And they notice — sharply — when the rest of it doesn't.
A note on the data: This survey was conducted between January and March of 2019 by Harvey Research, Inc., commissioned by the Pittsford Village Board. Some of what it captured has changed significantly: 75 Monroe was an open and bitterly contested question then and is now under construction after 15 years of iterations; the Northwest Quadrant land is now the Erie Canal Park and Preserve; retail has continued its difficult slide; a new mayor was elected in 2021. The Village has not conducted a formal resident survey since. What follows is a portrait of a moment — offered in that spirit, with that limitation stated plainly.
Who Lives Here and Why They Stayed

Who Lives Here and Why They Stayed
The 287 residents who responded were not a perfect cross-section of the Village. They skewed older — significantly older. The mean age of respondents was 57.6 years, the median 58.6. The U.S. adult median at the time was 47.2. Nearly 36% of respondents were 65 or older.
That matters for how you read the rest of the data. The voices in this survey belong mostly to long-established homeowners — people with deep roots in the Village and a strong stake in how it changes. Renters, younger families, and newer arrivals are underrepresented. Keep that in mind as you go.
Nine out of ten respondents owned their home. Just 8% rented — in a Village where roughly 26% of households on the mailing list were renters. Renters responded at a rate of 8.4% compared to 35.5% for owners. This survey heard overwhelmingly from homeowners.
A quarter of respondents had lived in the Village five years or less — suggesting meaningful turnover at the edges even in a community defined by stability. But nearly one in five had lived here more than 35 years. The average was 18.3 years. This is a place people stay.
When asked about plans for the next three years, 75% said they weren't going anywhere. But 13% said they expected to leave the Village — a number worth watching in a community of roughly 1,300 to 1,400 people. That's potentially one in eight households turning over within a three-year window.
What drew people here in the first place comes through clearly in the open-ended responses — not in one dramatic quote but in the same words appearing again and again, unprompted, across hundreds of responses. Walkability. The canal. Historic character. The library. Schools. The sense that you can get somewhere on foot that's worth going to.
These aren't amenities people stumbled into. They're the reason people chose this place. And they set a high bar for everything the Village does next.
The One Thing Government Gets Unambiguously Right

The One Thing Government Gets Unambiguously Right
I'll tell you what the "+++" means to me personally.
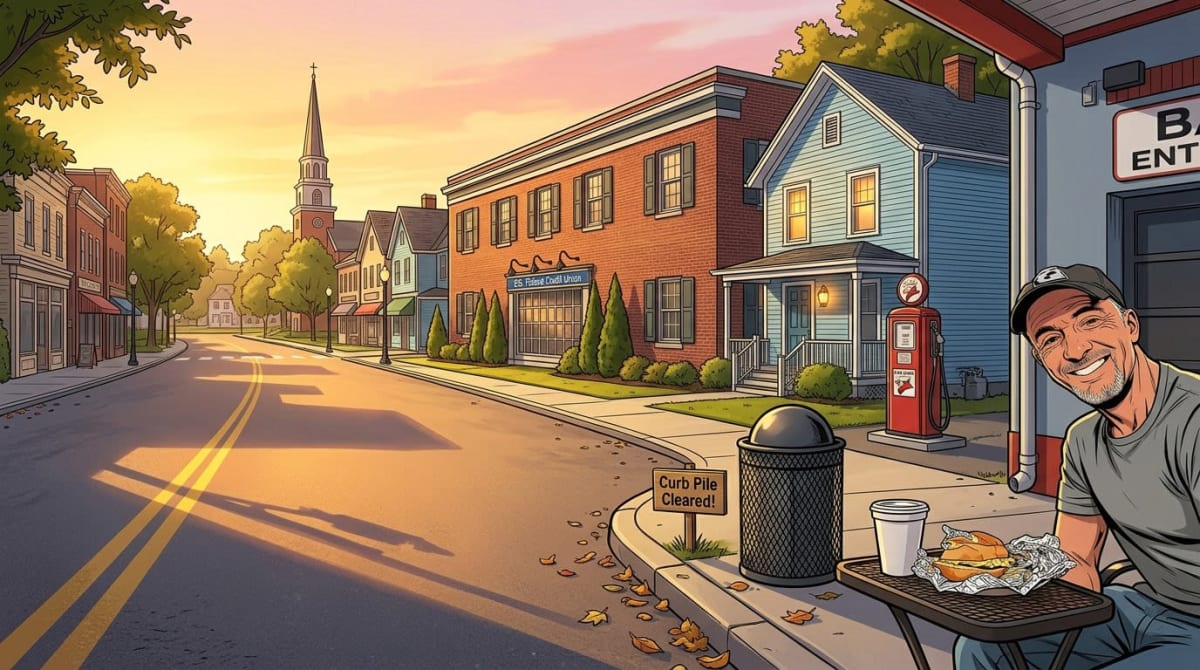
We have nearly an acre backing up to the Erie Canal — a property dense with mature trees, brush, and the kind of ongoing clearing work that a canal-side lot in upstate New York demands year-round. Fallen branches. Storm debris. The steady accumulation of what old trees leave behind. Many weeks, we haul a pile to the curb. And reliably, the DPW crew comes and takes it away.
No drama. No missed pickups. No phone calls. Just a crew that shows up, does the work, and disappears. Season after season.
That reliability is not a small thing. In a village where residents have strong opinions about nearly everything their government does — and this survey is evidence of exactly that — the DPW earns something rare: genuine, unqualified affection.

There is a moment in the Harvey Research report that makes this concrete.
The researchers asked residents to rate six Village departments and boards. They used a standard scoring methodology — a ratio of excellent and good ratings to poor ones. A ratio of 3.0 is strong. A ratio of 2.0 is acceptable. Below 2.0 is cause for concern.
The Department of Public Works didn't get a ratio. It got three plus signs.
"+++" — the researchers' way of saying the number is so far beyond the scale that a ratio would be misleading. DPW rated 83% excellent or good. Just 1% rated them poor. The ratio of positive to negative was so lopsided it couldn't be meaningfully compared to the other departments.
Village Hall staff also earned "+++", at 68% excellent or good.
Then the cliff.
The governance boards — the bodies that make decisions shaping the Village's future — clustered between 34% and 42%. The Mayor's Office rated 39% excellent or good, with 20% rating it outright poor. The Board of Trustees: 37% excellent or good, 16% poor. Planning and Zoning: 34% excellent or good, 13% poor. The Historic Preservation Board: 42% excellent or good, 15% poor.
To be fair, governance is harder to love than leaf collection. Boards make decisions that disappoint people. They say no to things residents want and yes to things they don't. The DPW just shows up and does the work. That asymmetry is built into how citizens experience government.
But the gap here is too wide to explain away. Residents weren't just rating satisfaction with outcomes. The open-ended comments make clear they were rating something deeper — trust, transparency, responsiveness, whether they felt heard. And on those measures, the delivering end of Village government and the deciding end are living in different worlds.
The researchers also asked residents how satisfied they were with the quality and frequency of information they received from the Village.
52% rated information quality as excellent or good — but 38% rated it fair or poor. Frequency was worse: just 40% excellent or good, with nearly half rating it fair or poor. Residents weren't just frustrated with decisions. They felt left out of the conversations that led to them.
There is a phrase getting renewed attention in discussions about what makes local government work — the idea that government earns trust not through grand gestures but through reliable, visible delivery of things people depend on every day. Historians trace this back to early 20th-century Milwaukee, where mayors who obsessed over sewers, clean water, and public parks earned the most trusted municipal government in the country — not by being ideologically interesting, but by being relentlessly competent at the unglamorous stuff. The leaf truck in October. The plowed sidewalk in February. The pothole that gets fixed without anyone filing a complaint.
Pittsford's DPW has been doing exactly that, quietly, for decades. The "+++" in the margin of a 2019 research report is the evidence.
Getting Around: The Village's Biggest Frustration
Getting Around: The Village's Biggest Frustration
If the DPW data is the surprise in this survey, the traffic data is the confirmation of something every Pittsford resident already knows in their bones.
Speed of traffic rated the single worst score in the entire survey. Not fair. Not mixed. Poor — by 54% of respondents. That is not a plurality. That is a majority of Village residents telling their government, in a formal survey, that the speed of cars moving through their community is unacceptable.
The open-ended comments don't leave much room for interpretation.
"People drive ridiculously fast and with the amount of pedestrians and children, it's unacceptable."
"We live on Main Street and have been nearly hit a dozen times at visible crosswalks by speeding cars."
"My car was parked on S. Main at 7:30 a.m. and was hit by a car going so fast it flipped over."
"For the past 39 years speed and traffic have been a pressing issue. No resolution seems to have worked."
That last one is worth sitting with. Thirty-nine years.
Level of traffic rated poor by 43%. Walkability and pedestrian safety — despite being one of the primary reasons residents chose to live here — rated poor by 33%. Nearly one in three residents felt unsafe walking in a Village they specifically selected for its walkability. That tension runs through dozens of open-ended responses.
Bikeability rated poor by 27% — but notably, 17% said they weren't sure how to rate it, suggesting many residents simply don't bike on Village roads at all. The canal path earns consistent praise in the comments. The roads do not.
Parking was the relative bright spot — 70% acceptable or good, 26% poor. The open-ended comments suggest parking frustration is concentrated around Schoen Place and the Four Corners intersection rather than distributed evenly across the Village.
What makes the traffic data particularly striking is the geographic specificity of the complaints. Residents didn't say "traffic is bad." They named streets. Jefferson Road appears more than any other. Monroe Avenue. South Main. Church Street as a cut-through. The corner of Main and Monroe. Sutherland Street near the high school. These are precise observations from people who walk these streets every day.
The survey was conducted in 2019. Since then, the Village has made some investments in pedestrian infrastructure — new sidewalks on South and Wood Streets are underway as of this writing. Whether the underlying speed and volume problems have improved is something only a new survey could tell us.
What the 2019 data makes clear is that residents understood the stakes. In the open-ended section asking about highest priorities, traffic and pedestrian safety appeared more than any other concern. Not retail. Not development. Not governance.
Getting across the street safely.
What's Thriving and What's Struggling
What's Thriving and What's Struggling
Not everything in the 2019 survey is a warning sign. Two findings rated extraordinarily well — and they point directly to what residents value most about living here.
Maintaining the Village's historic character rated 78% excellent or good. Just 1% poor. Maintaining property values rated 75% excellent or good. Again, just 1% poor. These are the two things Pittsford has protected most deliberately over decades — through historic preservation districts, architectural review, careful zoning — and residents see it. They chose this place partly because of it, and they feel the return on that investment every day.
Then comes the other side of the ledger.
Retail store health and viability rated 24% excellent or good. Variety of commercial establishments rated 22%. Both had 71-73% of respondents rating them fair or poor. Nearly three quarters of respondents said the commercial life of their Village was failing to meet their needs.
The open-ended responses are a long, specific wish list that tells its own story. Residents weren't asking for luxury. They were asking for the basics that used to exist and don't anymore.
A grocery store. A pharmacy. A hardware store. A dry cleaner. A bookstore. A diner. A butcher.
"When we moved in, we could pretty much not need the car to get what was needed. This is what attracted us. Now no grocery, pharmacy, department store."
"Village lifestyle, availability of amenities and shops — some of which have disappeared."
"It's a friendly place with wonderful neighbors. While there was once more variety of places to go — a grocery store, a pharmacy, a liquor store, a dry cleaner — it's great walking, with some good eateries."
The through-line is loss. Not dissatisfaction with what exists, but grief for what used to. Residents didn't just want more shops. They wanted back the version of walkability that meant genuine daily errands on foot — the kind that doesn't require a car trip to Wegmans for eggs.
This tension sits at the center of the Village's commercial challenge. The historic character that makes Pittsford attractive also makes it expensive. High rents, strict architectural requirements, limited square footage, and the structural pressures facing retail everywhere have combined to push out exactly the kinds of businesses residents most wanted to keep. What replaced them — salons, boutiques, upscale restaurants — are appreciated but not sufficient.
"Too many hair salons — seems they outnumber everything else."
That line appeared, in various forms, more than once.
How residents preferred to hear from the Village about all of this is also revealing. Email and hard mail newsletters tied as first choice at 28% each. Social media ranked fourth at just 9%. This is a community that wants deliberate, curated communication — not algorithmic feeds.
The fact that 38% rated Village communication quality as fair or poor, and nearly half rated frequency as fair or poor, suggests a real gap between what residents wanted and what they were getting. In a village of roughly 1,300 people, that gap is bridgeable. Whether it has been bridged in the years since is another question the data can't answer.
The Big Land Questions

The Big Land Questions
In early 2019, three pieces of land defined the Village's future in ways residents felt acutely. The survey asked about all three directly. The answers were unambiguous. What actually happened is more complicated.
The Northwest Quadrant
The Village owned roughly 12.5 acres of land on the north side of the Erie Canal — the DPW barns complex surrounded by wooded wetlands, streams, and meadows. The survey asked residents to rank their preferences for what should happen to it. The answer was not close.
76% of respondents ranked natural green space and public recreational use as their first or second preference. Just 9% wanted any form of residential housing. The message was unambiguous: keep it green, make it accessible, let people walk there.
That is largely what happened. By early 2020, the Village approved the Erie Canal Park and Preserve — a shared-use trail connecting the Auburn Trail to the Erie Canalway Trail, anchored by the reconstruction of a salvaged 1850s historic barn along the canal. Residents asked for trails and green space. They got trails and green space.
The Schoen Place Barns
A separate question asked about the historic barns on the commercial canal side at Schoen Place — between the Erie Canal and protected farmland to the north. Residents were asked: rehabilitate with mixed-use infill, or demolish for new construction?
71% chose rehabilitation and mixed-use infill. 21% preferred demolition and new construction. That preference for preservation over replacement is consistent with everything else residents said throughout the survey — historic character is the thing they value most and want protected most. As of this writing, the Schoen Place barns question remains more open than the Northwest Quadrant. That story continues.
75 Monroe
No question in the 2019 survey generated more open-ended passion than this one. The proposal before the Village at that time was for 167 residential rental units on a 7.4-acre site at 75 Monroe Avenue — between the CSX railroad tracks and the canal. The survey described it plainly: this would represent the largest concentration of buildings in the Village, roughly twice the size of the Sutherland High School complex and more than twice the size of all Main Street retail buildings combined.
55% wanted the project reduced by about a third. 23% supported it as submitted. 39% wanted something else entirely, with many open-ended responses calling for the project to be stopped or redesigned from the ground up.
What actually happened took another seven years to resolve.
Developer Mark IV Enterprises had first proposed developing the site around 2007-2008. The land was a former industrial oil facility — so contaminated it was designated a Brownfield remediation site in 2015. Over the following 15 years, the project went through multiple redesigns, sparked numerous lawsuits, consumed 179 public meetings, and outlasted multiple mayors and board compositions.
The 2019 survey captured residents at a specific and acute moment in that saga. Their anxiety in the open-ended responses is palpable.
"75 Monroe. Too big."
"RESOLVE MONROE 75!!! Far too expensive."
"The debacle of 75 Monroe. What's the Village's end game?"
Final approval came in October 2022, with the project redesigned and reduced by nearly 35% from the original proposal. Even then, a new legal dispute over a COMIDA funding denial kept the project in limbo through 2024. Construction began in earnest in 2025. The development — now called Westport Crossing, 156 units — is leasing for Fall 2026 move-in.
The version that got built is meaningfully smaller than what residents were reacting to in 2019. Whether it is what the community wanted is a question residents will begin answering in their own way this fall.
Civic Life: Who's Engaged, Who Isn't, and What We Still Don't Know

Civic Life: Who's Engaged, Who Isn't, and What We Still Don't Know
The 2019 survey closed with a set of questions about civic participation that deserve their own honest reading.
Only 10% of respondents said they were currently involved in Village government or volunteering in any official capacity. Nearly nine in ten were not. In a community where the open-ended responses overflow with opinions about traffic, retail, development, and governance, that gap between caring and participating is worth sitting with.
When asked whether they would consider serving on a Village board — the Historic Preservation Board, Planning and Zoning, or similar — just 14% said yes.
66% said no. 20% didn't answer at all.
29% said they would participate in a focus group on Village issues — a notably higher number than those willing to serve on a board. People want to be heard. They are less certain they want to be responsible.
That distinction matters. The frustration with governance boards that runs through this survey is not simply about outcomes. It is about process. Whether residents felt informed. Whether they felt consulted. Whether the deciding end of Village government operates with the same reliability and transparency that the delivering end does.
The DPW shows up. Season after season, without drama, without litigation, without a constituency of opponents. The boards make harder calls in a more contested arena. That asymmetry will always exist. But the gap in trust this survey documents — 83% for the DPW, mid-30s for the governance boards — is too wide to be explained by the difficulty of the work alone.
The Village of Pittsford has not conducted a formal resident survey since 2019. That is now seven years without a systematic, anonymous opportunity for residents to tell their government what they think. The 287 people who wrote back in 2019 did so at a 28.4% response rate — nearly triple the industry norm. They wanted to be heard.
What would they say today? After a pandemic that made neighborhood and walkability feel more precious. After 75 Monroe finally broke ground after 15 years. After new sidewalks on South and Wood Streets. After a change in mayor. After more retail turnover. After the Erie Canal Park opened.
Some of the frustrations in this data have almost certainly evolved. Some have almost certainly not. Traffic on Jefferson Road is probably still too fast. The wish for a small grocery store is probably still alive. The pride in the DPW — the leaf truck in October, the plowed sidewalk in February, the crew that just shows up — that almost certainly hasn't moved an inch.
This is a Village that knows what it values. It chose this place deliberately, for what collective investment had already built. The canal. The sidewalks. The library. The historic streetscape. The sense that you can walk somewhere worth going.
The question the 2019 survey leaves open — the one that a new survey might begin to answer — is whether the parts of Village government that residents trust least can earn their way toward the standard the DPW has quietly set for decades.
Not perfect. Not without friction. Just reliable. Present. Worth showing up for.
Content ID: Aannn2ZBCNmb1UBKpIpkOhpd
See an error? Tell us.